
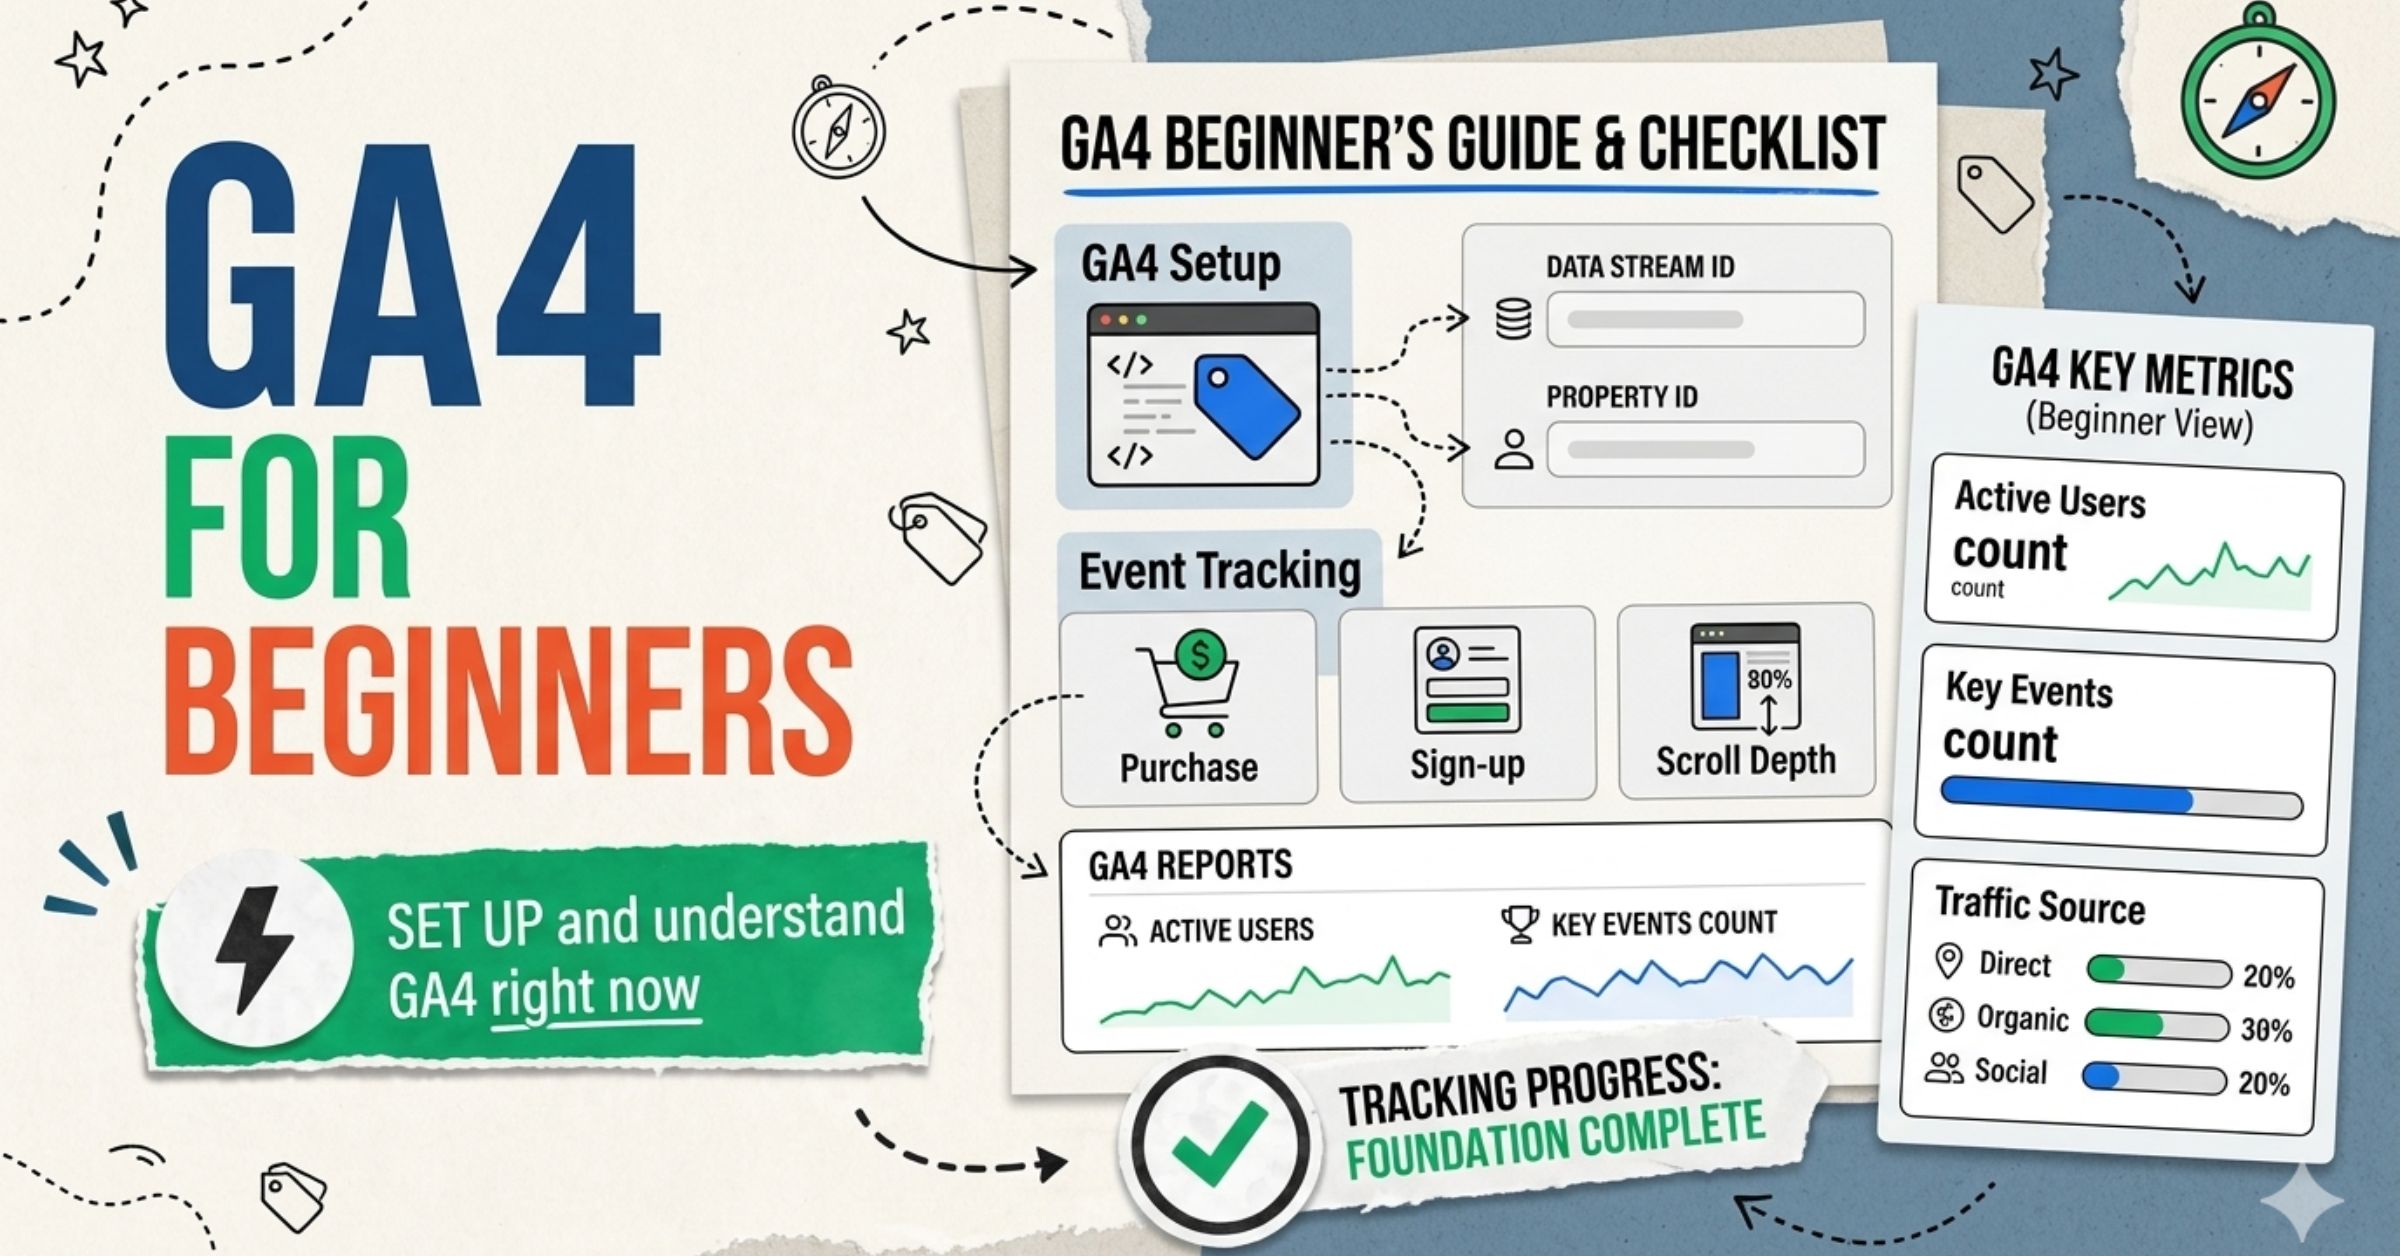
If you’ve heard of Google Analytics 4 but have no idea what it actually does or how to use it, you’re not alone. GA4 looks different, works differently, and even uses different words than what most people are used to.
This guide is written for real people, not data scientists. Whether you’re a small business owner, a blogger, or someone managing a client’s website, this chapter will walk you through everything: what GA4 is, how to set it up, how to read your reports, and what to actually pay attention to.
No jargon. No fluff. Just what you need to know.
What you will learn in this chapter
→ What GA4 is and how it differs from the old Google Analytics
→ How to create and set up a GA4 property (step-by-step)
→ What events, sessions, and users mean in plain English
→ How to read your reports and find useful data
→ What metrics to ignore (and which ones actually matter)
→ How to set up conversion tracking
→ What Explorations are and when to use them
→ Common beginner mistakes to avoid
What Is GA4, and Why Does It Exist?
Google Analytics 4 is Google’s current analytics platform. It replaced Universal Analytics (the old GA) in July 2023, meaning if you haven’t migrated yet, your old data is now read-only, and new data is only being collected in GA4.
GA4 is a tool that sits on your website and tracks what visitors do — which pages they visit, how long they stay, where they come from, what they click, and whether they complete actions like buying something or filling out a form.
How Is GA4 Different from the Old Google Analytics?
The old analytics (Universal Analytics) counted everything by “sessions” — a session was basically a visit. GA4 thinks differently. It tracks individual actions called events. Everything in GA4 is an event: a page view, a scroll, and a button click.
| Old Google Analytics (UA) | Google Analytics 4 (GA4) |
|---|---|
| Sessions (visits) were the center of everything | Individual actions (events) are the center of everything |
| Bounce rate measured single-page visits | Engagement rate measures meaningful interactions |
| App and website data were separate | Website and app data are combined in one property |
| Limited privacy controls | Built-in data controls for GDPR, CCPA compliance |
| Required cookies for most tracking | Works with cookieless measurement and consent mode |
GA4 shows you what people do on your site more accurately. A person who visits a page, reads for 2 minutes, and leaves without clicking anything will no longer show as a ‘bounce’ — GA4 counts them as engaged because they spent time there.
2. How to Set Up GA4 (Step by Step)
Setting up GA4 is a one-time task. Once done, data starts flowing, and you can start learning from it. Here is exactly how to do it.
Step 1: Create a Google Analytics Account
Go to analytics.google.com and sign in with your Google account. If you don’t have an account yet, create one — it’s free.
Click “Start measuring.” You’ll be asked to:
- Give your account a name (e.g., your business name)
- Choose your data sharing settings (leave defaults if unsure)
Step 2: Create a GA4 Property
A “property” in GA4 is your analytics workspace for one website or app. Each property collects data independently.
- Enter your property name (e.g., “My Website – GA4”)
- Select your reporting time zone and currency
- Click Next, fill in your business details, and click Create
Step 3: Add a Data Stream
A data stream is the connection between your website and GA4. After creating the property, GA4 will ask you to set up a data stream.
- Choose “Web” as the platform
- Enter your website URL and stream name
- Click Create Stream
You’ll see a Measurement ID — it looks like G-XXXXXXXXXX. This is your unique tracking code. Keep this window open.
Step 4: Install the Tracking Code on Your Website
This is the step most beginners find confusing. You need to add the GA4 tracking code to your website so it can collect data.
Choose your installation method:
- WordPress (using a plugin): Install a plugin like “Site Kit by Google” or “MonsterInsights.” Connect it to your Google account, and it will install the code automatically.
- Any website (using Google Tag Manager): Set up a Google Tag Manager container, add a new GA4 tag with your Measurement ID, and publish. This is the recommended method for most websites and fits neatly into your broader technical SEO setup.
- Direct code install: Copy the Global Site Tag (gtag.js) code from the data stream setup screen and paste it into the <head> section of every page.
Step 5: Verify Data Is Flowing
Once installed, go to Reports → Realtime in GA4. Open your website in a new tab and visit a few pages. Within 30 seconds, you should see yourself appear in the Realtime report as an active user. If you do, installation is complete.
3. Understanding the Language of GA4
GA4 uses specific words that mean specific things. Getting these straight early will save you a lot of confusion later.
- Event: Any action on your website — page view, click, scroll, form submit, purchase. Everything in GA4 is an event.
- Session: A visit to your website. A session starts when someone arrives and ends after 30 minutes of inactivity.
- User: A unique visitor. GA4 uses device fingerprinting and (optionally) User IDs to track the same person across visits.
- Engaged Session: A session that lasted more than 10 seconds, had a key event, or had at least 2 page views.
- Engagement Rate: The percentage of sessions that were engaged. Replaces bounce rate from old GA.
- Key Event: An event you’ve marked as important — formerly called “Conversion.” Example: form submission, purchase.
- Dimension: Describes what something is. Examples: country, device type, page title, traffic source.
- Metric: A number that counts something. Examples: sessions, users, event count, revenue.
- Parameter: Extra detail attached to an event. Example: a purchase event might include parameters such as item_name, value, and currency.
Think of your website as a store. A User is a customer who walks in. A Session is their visit. Events are every action they take (picking up a product, reading a sign, walking to the register). A Key Event is completing a purchase. Dimensions are things like “came from downtown” or “paid by card.” Metrics are counts: 3 visits, 12 actions, 2 purchases.
4. Automatic Events: What GA4 Tracks Without Any Setup
One thing GA4 gets right: it automatically tracks a lot of useful events the moment you install the tracking code. You don’t need to configure anything extra for these.
Automatically Collected Events
- page_view — fires every time a page loads
- session_start — fires at the beginning of each new session
- first_visit — fires the first time someone visits your site
- user_engagement — fires when the page is in focus for at least 1 second
Enhanced Measurement Events (Turned On by Default)
In the data stream settings, GA4 has Enhanced Measurement turned on by default. This adds:
- scroll — fires when a user reaches 90% of a page
- click — fires when someone clicks an outbound link (leaving your site)
- view_search_results — fires when someone uses your site’s search function
- video_start / video_progress / video_complete — for YouTube embeds
- file_download — when someone clicks a PDF, ZIP, or similar file link
With just these automatic events enabled, you already have meaningful data about where people come from, which pages they visit, how far they scroll, and whether they click off to other sites. Most small businesses can get real value from these events alone before adding any custom tracking.
5. Reading Your GA4 Reports
The GA4 interface is organized into sections in the left sidebar. Here is what each one does and what you should look at when you’re starting.
- Home: The first screen you see. It shows quick stats for the last 7 days — users, new users, revenue (if you track it), and a few charts. Good for a daily pulse check, but don’t base decisions on this alone.
- Realtime Report: Found under Reports → Realtime. Shows what’s happening on your site right now: how many people are active, which pages they’re on, and where they’re coming from. Useful for verifying that your tracking is working or monitoring during a campaign launch.
- Reports Snapshot: A customizable overview of your most important data. By default, it shows users, sessions, engagement rate, and revenue. This is a good daily/weekly check-in view.
Acquisition Reports
These answer the most important question in analytics: where are my visitors coming from?
- Traffic Acquisition — shows sessions by channel (organic search, direct, social, referral, email, paid)
- User Acquisition — shows how users were first acquired (their very first session source)
The difference matters. Traffic Acquisition shows all sessions; User Acquisition shows how people discovered you for the first time. For SEO analysis, Traffic Acquisition is usually more useful.
Engagement Reports
Shows what people do once they’re on your site.
- Events — all the events firing on your site, with counts
- Key Events — only the events you’ve marked as important
- Pages and Screens — which pages get the most views, average engagement time per page
What to look at first in your engagement reports:
Sort by “Views” to see your most visited pages. Then sort by “Average Engagement Time” — high-traffic pages with low engagement time may have content problems — work through an on-page SEO checklist to diagnose and fix them.
Check whether key user actions (form views, button clicks) are being captured.
Retention Reports
Shows whether users come back. The retention chart shows what percentage of users who first visited in a given week returned in the following weeks. A healthy site has users returning; a poor retention curve drops to near-zero after week 1.
Demographics and Tech Reports
- Demographics — age, gender, interests of your users (requires enabling Google Signals)
- Tech — which devices, browsers, and operating systems your visitors use
The Tech report is immediately useful: if 70% of your visitors use mobile but your site performs poorly on mobile, you have a clear problem to fix — start with site speed and Core Web Vitals.
6. Setting Up Key Events (Conversions)
A Key Event is any action on your site that represents a meaningful outcome. In GA4, you designate events as Key Events — this is what used to be called ‘Conversions’ in the old analytics.
Examples of Key Events to track:
- Form submission (lead generation)
- Purchase completed (ecommerce)
- Phone number click (service businesses)
- PDF download (content marketing)
- Account sign-up or free trial started (SaaS)
Let’s look at a practical application: If you are tracking a brick-and-mortar client, you can use these exact event tracking methods to monitor traffic generated from your local search optimization campaigns.
How to Mark an Event as a Key Event
Go to Admin → Events. You’ll see a list of all events being tracked. Find the event you want to mark, and toggle on “Mark as key event.” It will now appear in your Key Events report and count as a conversion.
One of the most common mistakes I see across websites: GA4 is installed, data is flowing, but nobody has set up key events. Without key events, you can see traffic, but you can’t measure business outcomes. This is the single setup step that turns analytics from a vanity dashboard into a business tool. Do this within the first week of installing GA4.
7. Explorations: Going Deeper Than Standard Reports
The standard reports give you a solid overview. But if you want to answer specific questions — like where exactly in your checkout process people drop off, or which blog posts lead to form submissions — you need Explorations.
Explorations are found in the left sidebar under Explore. Think of them as custom analysis tools you build yourself. You’re not stuck with what Google decided to show you by default.
The 7 Exploration Types (Plain English)
- Free-form: Build your own table or chart with any combination of dimensions and metrics. Most flexible option.
- Funnel Exploration: Define a sequence of steps (e.g., homepage → product page → cart → purchase) and see where people drop off.
- Path Exploration: Discover what pages users visit after a specific starting point, or what they did before reaching a specific page.
- Segment Overlap: Compare two or three audiences. E.g., “How many mobile users also completed a purchase?”
- User Explorer: Look at the individual session history of a specific user (anonymized). Useful for debugging tracking issues.
- Cohort Exploration: Group users by when they first visited and see how they behave over time. Good for measuring retention.
- User Lifetime: See the total value a user has generated since their first visit. Good for e-commerce.
When Should a Beginner Use Explorations?
Start with standard reports for the first 2–3 months. Once you’re comfortable reading traffic and engagement data, move into Explorations when you have a specific question that the standard reports can’t answer. A good first Exploration for most sites is a Funnel — for example, tracking how many people visit your contact page versus how many actually submit the form.
For more advanced data setups and tracking configurations beyond the basics, return to our main index of analytics guides.
8. Metrics That Matter vs. Metrics That Don’t
GA4 shows you dozens of metrics. Most beginners either look at too few (just “visitors”) or get overwhelmed by all the numbers. Here is what actually tells you something useful.
Organic Users tells you how many people found you through search, but not which terms they used — pair it with keyword rank tracking to connect rankings to traffic.
Metrics Worth Your Attention
- Organic Users (from GA4, filtered to Organic channel) — how many people found you through search
- Engaged Sessions — sessions with meaningful activity; a much better signal than raw session count
- Engagement Rate — percentage of sessions that were engaged (aim for above 50–60%)
- Key Events — how many times have your important actions happened
- Average Engagement Time per Session — how long users are actively on your site
- Pages per Session — whether users explore beyond the landing page
Metrics to Use Carefully
- Total Users — useful directionally, but inflated by bots, crawlers, and mismatched cross-device tracking
- Sessions — a count of visits; more sessions don’t mean more value
- Bounce Rate — in GA4, this is 1 minus engagement rate, so a high bounce rate isn’t automatically bad if users are spending time on the page
I worked with a luxury remodeler whose GA4 metrics looked flat for months — sessions were down, clicks were down. But they kept receiving organic phone calls. The issue: calls weren’t being tracked as key events, so the data didn’t reflect actual business outcomes. Always set up key events that map to how your business generates revenue — otherwise, your dashboard will lie to you.
9. Common Beginner Mistakes (and How to Avoid Them)
Analytics mistakes compound the same way broader SEO mistakes do — here’s what to watch for.
- Not setting up Key Events: Without conversion tracking, you’re flying blind. Set up at least one key event in week one.
- Looking at data before you have enough of it: Give GA4 at least 30 days of data before drawing conclusions. One week is too noisy.
- Comparing GA4 numbers to old Universal Analytics: The methodologies are different. Numbers will not match. Start fresh baselines in GA4.
- Tracking your own visits: Filter out your IP address in Admin → Data Filters → Internal Traffic. Otherwise, you inflate your own data.
- Installing GA4 twice: Common when using a plugin AND pasting the code manually. Check for duplicate tags in Google Tag Manager or your plugin settings.
- Ignoring the Realtime report during setup: Always verify your tracking is working with Realtime before closing your setup screen.
- Not checking the Tech report early: If the majority of your users are on mobile and your site isn’t mobile-friendly, fix that before focusing on anything else.
Many marketers struggle to prove the ROI of organic marketing, leading them to believe common SEO myths that are wasting their money. Clean analytics data is the antidote to these misconceptions.
10. Your First Week in GA4: A Practical Checklist
Here is exactly what to do once your GA4 property is live. Don’t try to do everything at once — follow this order.
Week 1 Setup Checklist
- Property created and tracking code installed correctly
- Verified in Realtime report — you appear as an active user
- Enhanced Measurement is turned on in Data Stream settings
- Internal traffic filter set up (so your own visits don’t count)
- At least one Key Event marked (form submission, purchase, phone click)
- Connected GA4 to Google Search Console (Admin → Property Settings → Search Console)
- Checked Tech report — know your mobile vs. desktop split
- Bookmarked the Acquisition → Traffic Acquisition report for weekly check-ins
Quick Questions About GA4
Is GA4 free?
Yes. The standard version of GA4 is completely free. There is a paid version called Google Analytics 360 for enterprise use, but 99% of businesses will never need it.
Do I need coding skills to use GA4?
No. Basic GA4 setup (creating a property, reading reports) requires no coding. If you want to track specific custom events — like a button click that isn’t covered by Enhanced Measurement — you’ll need either a developer or Google Tag Manager, which has a beginner-friendly interface.
How long does it take for GA4 data to appear?
Standard reports can have a delay of 24–48 hours. The Realtime report shows data within seconds. Explorations pull data more recently but may also show some lag.
Can I see who specifically visited my site?
No. GA4 anonymizes user data — you can see behavior patterns (what pages were visited, what actions were taken) but not personally identifiable information like names or email addresses. User Explorer shows anonymized user IDs, not real identities.
What is the difference between a user and a session in GA4?
A user is a unique visitor (identified by a unique ID). A session is a visit. One user can have multiple sessions — if someone visits your site on Monday and again on Thursday, that’s one user and two sessions.
Should I use GA4 with Google Tag Manager?
Yes, for most websites. Google Tag Manager makes it much easier to add and manage tracking tags without modifying your website’s code every time. It’s especially useful when you want to add custom event tracking beyond the automatic events.
What Comes Next
This chapter covers the foundations of GA4 — how it works, how to set it up, and how to read your data. Once you’re comfortable with these basics, the next chapters in this series will go deeper.
The goal is not to be a data expert. The goal is to understand what your website visitors are doing, whether they’re doing what you want them to do, and what to change when they’re not. GA4 is the tool — this guide is your starting point. If you’re still building your SEO foundations, our most common SEO questions answered covers the basics you’ll want alongside your analytics.
Like what you are reading? Our library is packed with expert strategies! Jump over to The Crawl Theory Home, study our step-by-step SEO Guides, track the latest SEO News, or download our helpful SEO Resources.