In crawlability (Chapter 2) and indexability (Chapter 3), we got your pages found and stored. This chapter is about the final technical gate: speed. A slow page frustrates visitors, loses sales, and cedes rankings to faster competitors. Google measures this with Core Web Vitals — three numbers every site owner should know by heart.
I’m Yash from CrawlTheory. The reassuring news, after 300+ sites: you do not need to be a developer to make big speed gains. The first wins are usually images and scripts — straightforward changes with immediate, measurable impact. Let’s make your site fast.
Speed isn’t vanity. A one-second delay can cut conversions by around 7%. Faster pages keep visitors, win the tie-breaks in search, and get cited more by AI engines that favour reliable, well-built sites.
What Are Core Web Vitals (In Plain English)?
Core Web Vitals are three metrics Google uses to measure the real-world experience of your pages: how fast they load, how quickly they respond, and how stable they look while loading. The current set focuses on loading (LCP), interactivity (INP), and visual stability (CLS).
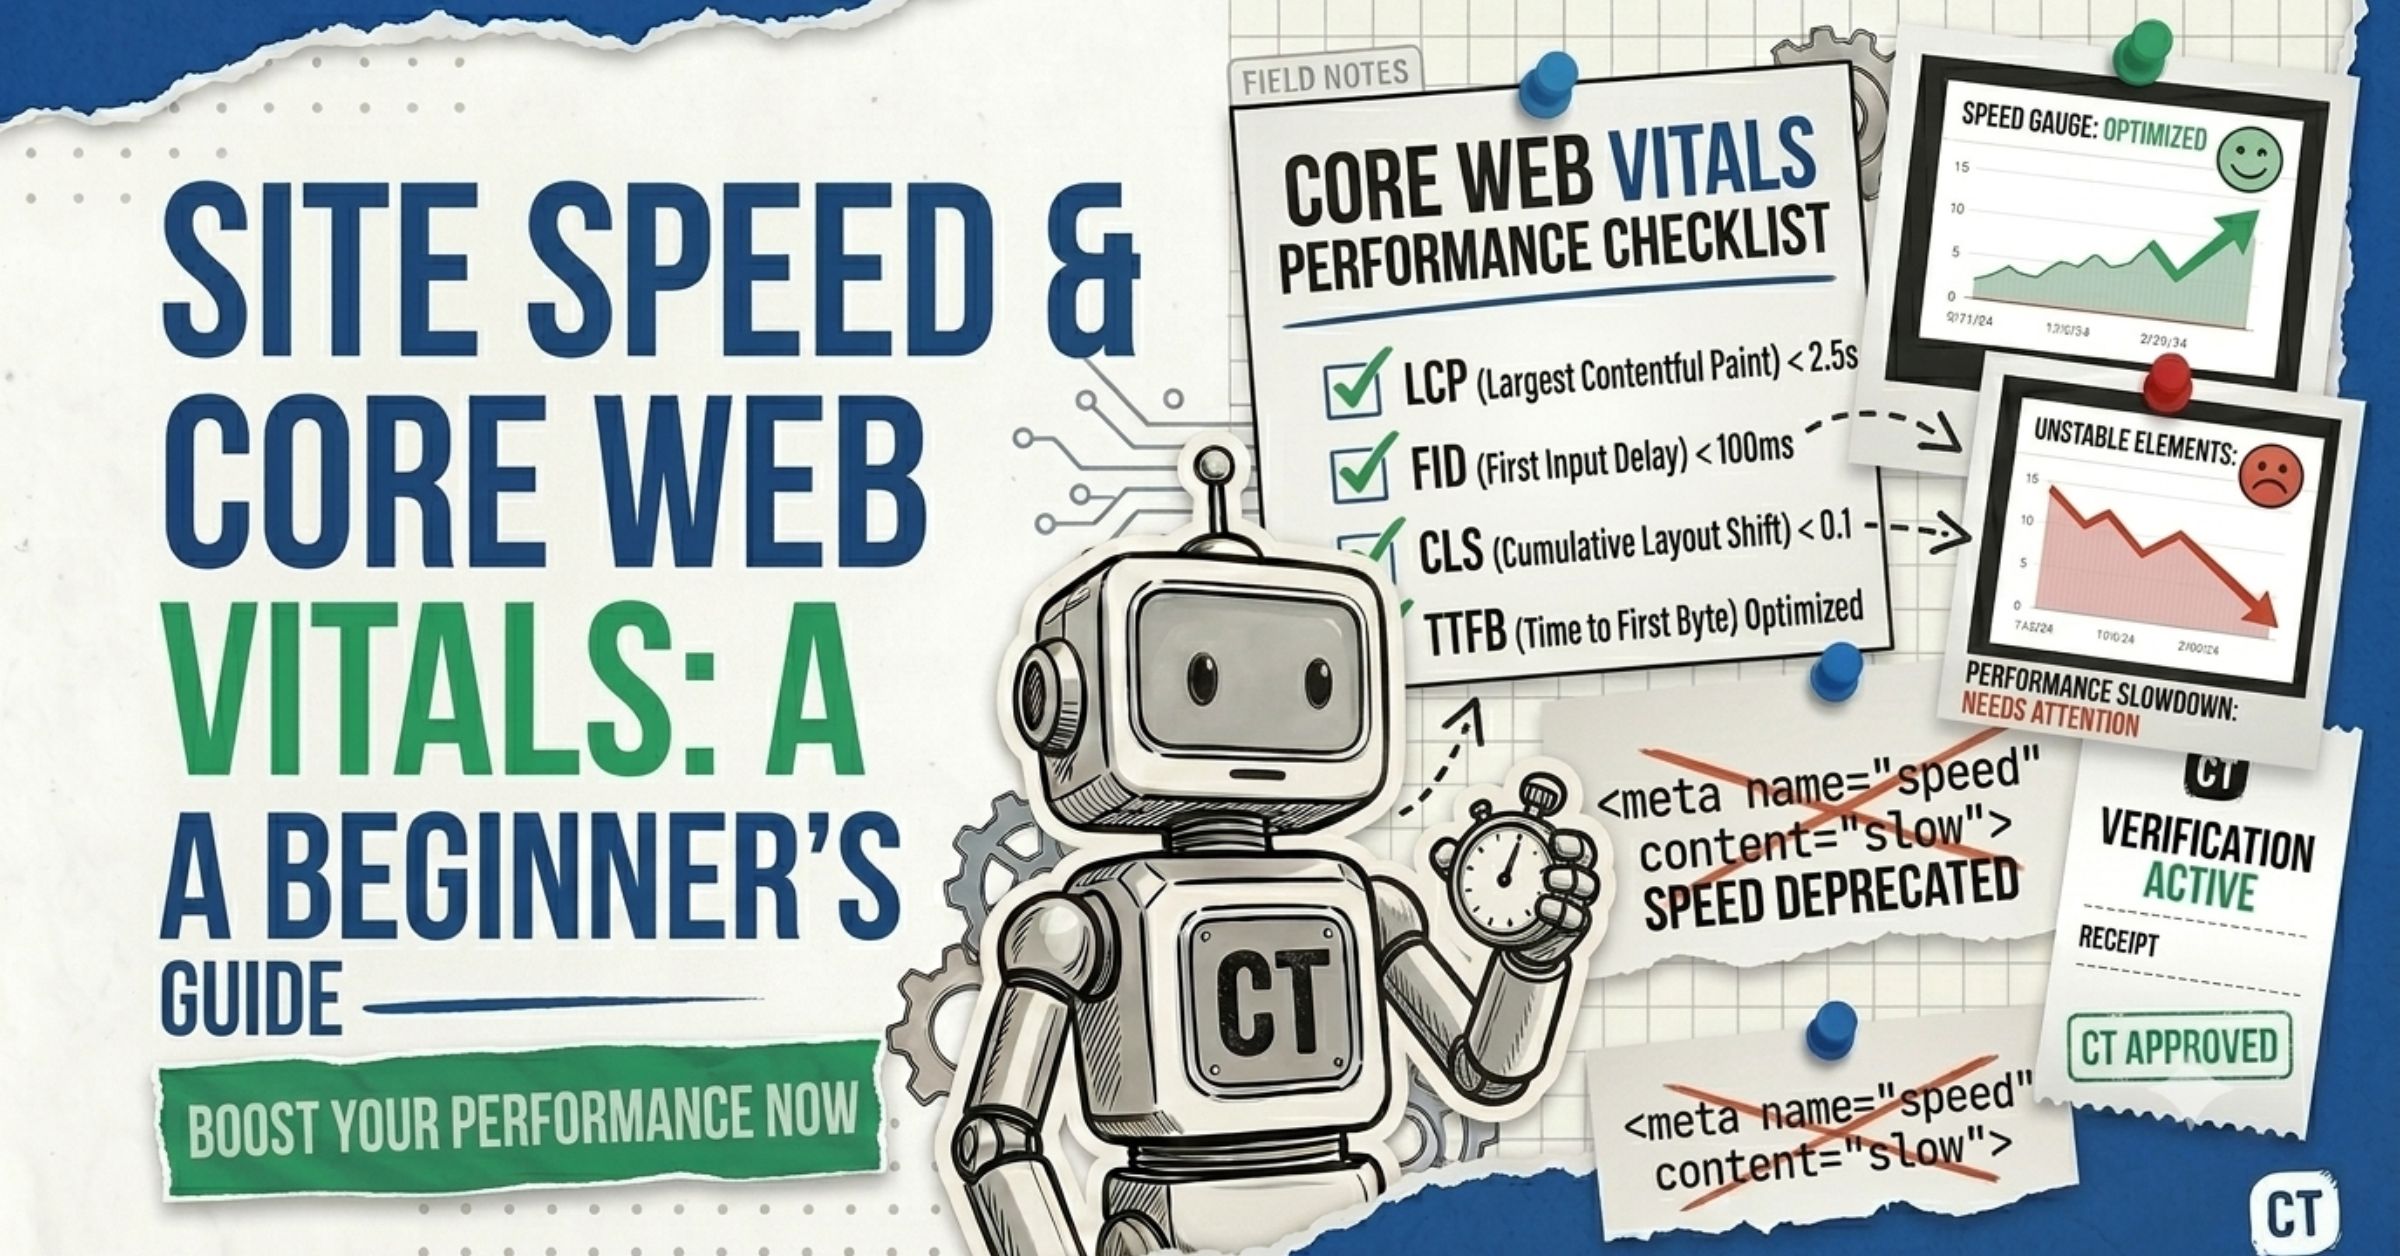
Here are the three, with the only numbers you need to remember:
| Metric | What it measures | ”Good” threshold |
|---|---|---|
| LCP — Largest Contentful Paint | Loading: how fast the main content appears | ≤ 2.5 seconds |
| INP — Interaction to Next Paint | Responsiveness: how fast the page reacts to clicks/taps | ≤ 200 milliseconds |
| CLS — Cumulative Layout Shift | Visual stability: does the layout jump around? | ≤ 0.1 |
To provide a good experience, LCP should occur within 2.5 seconds, INP should be 200 milliseconds or less, and CLS should be 0.1 or less — measured at the 75th percentile of page loads, across mobile and desktop.
That “75th percentile” detail changes everything. Google evaluates these at the 75th percentile of real visitor data, meaning at least 75% of visits must hit the “good” mark. Your site can feel instant on your MacBook and still fail, because the real test is a mid-range Android phone on a patchy connection. Design for the worst reasonable case, not the best.
Why do Core Web Vitals matter for SEO?
They’re a confirmed ranking signal — and a tie-breaker. Core Web Vitals are a confirmed Google ranking factor; while content relevance remains most important, they can serve as a tiebreaker when two pages have similar content quality. In competitive niches, passing them is a measurable edge. They also pay off commercially: sites passing all three thresholds see around 24% lower bounce rates and measurably better organic rankings.
Real businesses have documented the upside. Google’s own case-study repository includes results like Vodafone improving LCP by 31% and seeing 8% more sales — proof that speed is a revenue lever, not just a technical score.
Core Web Vitals are three Google metrics for real-user experience: LCP (how fast the main content loads, target ≤ 2.5s), INP (how fast the page responds to taps and clicks, target ≤ 200ms), and CLS (how much the layout shifts, target ≤ 0.1). A page must pass all three at once to be rated “good.”
Yes, they’re confirmed ranking signals and part of Google’s page experience signals. They act mainly as a tie-breaker: when two pages have similar content quality and authority, the faster, more stable one tends to win. Failing them puts you at a disadvantage in competitive search results.
LCP of 2.5 seconds or less, INP of 200 milliseconds or less, and CLS of 0.1 or less — all measured at the 75th percentile of real visitors. You need at least 75% of visits to meet each threshold, and all three must pass together for an overall “good” assessment.
Lab Data vs. Field Data: The Trap That Fools Beginners
Before you optimize, understand which number to trust. There are two kinds of speed data:
- Lab data — a simulated test on demand (Lighthouse, the speed score in PageSpeed Insights). Great for debugging, but it’s one synthetic run.
- Field data — what real users actually experienced, collected by Chrome into the Chrome User Experience Report (CrUX). This is what Google ranks on.
Optimize for field data, not the lab score. Teams routinely spend weeks polishing a 98 Lighthouse score while their actual INP — the metric that measures how responsive the site feels — sits firmly in the “poor” bucket for every mobile user. The gap between lab and field can be enormous.
One more thing about field data: CrUX is a 28-day rolling window, so your fix won’t fully appear in the data for up to four weeks. Patience is part of the process. Track the changes through the Core Web Vitals report in Google Search Console.
To validate a fix immediately (instead of waiting a month), use your own real-user monitoring or the free web-vitals JavaScript library to see live numbers, while you wait for CrUX to catch up.
How to Fix Each Core Web Vital
Here’s the practical part. We’ll tackle each metric with beginner-friendly, highest-impact fixes first. A useful rule of thumb on priority: compress the hero image → remove heavy third-party scripts → deploy CDN + caching → reduce JS bundle size.
Fixing LCP (loading speed)
LCP is how fast your biggest above-the-fold element — usually a hero image or headline — finishes rendering. The mistake everyone makes: blindly compressing every image. “The images” isn’t the fix — the LCP element is the fix, and it’s almost always one specific image above the fold. Find that element first (PageSpeed Insights names it), then:
- Compress and modernize that image. Converting images to WebP delivers a 25–35% file-size reduction with no visible quality loss — the single highest-impact free fix. AVIF is even smaller. Squoosh (free) does this in your browser.
- Tell the browser it’s important. Add
fetchpriority="high"to the LCP image so the browser loads it early. - Never lazy-load the hero image.
loading="lazy"on the hero image guarantees an LCP regression — the browser delays the most important image on the page. Lazy-load below-the-fold images only. - Fix a slow server (TTFB). A slow server nullifies everything — no amount of frontend optimization compensates for a 2-second server response. A CDN and good caching are the usual cure.
- Preload critical fonts. If your LCP is text in a custom font, use
font-display: swapand preload the font file.
Fixing INP (responsiveness) — the hard one
INP measures how fast your page reacts to every click, tap, and keypress during the visit — not just the first. 43% of sites still fail the 200ms threshold, making INP the most commonly failed Core Web Vital in 2026. Why so hard? Fixing INP requires deep JavaScript changes — you can’t simply compress an image or enable a cache; you need to rethink how your code handles user events.
Beginner-accessible wins first:
- Audit third-party scripts. Chat widgets, analytics, and ad pixels are often the primary culprits — each one adds work to the main thread. Remove what you don’t need; delay-load the rest. (Google Tag Manager can help consolidate and delay scripts.)
- Defer non-critical JavaScript so it doesn’t block the page while users try to interact. Developer-level wins (or a quick chat with yours):
- Break long tasks, defer non-critical work, yield to the main thread during interactions, and minimize DOM complexity.
- Offload heavy computation to Web Workers and load page-specific code only (code-splitting).
If you only have time for one speed project, profile your INP first. It’s the metric most likely to be quietly failing for your mobile users, and the one competitors most often ignore.
Fixing CLS (visual stability) — the cheapest win
CLS measures how much your layout unexpectedly jumps as the page loads — the button that shifts right as you go to tap it. It’s the easiest metric to fix:
- Set width and height on everything. Every image, video, and iframe should have explicit width and height attributes so the browser reserves space before the file downloads; this single fix often resolves most CLS failures.
- Reserve space for late content. For a third-party chat widget or ad, add a
min-heightto its container so an empty space appears instead of a shift. - Use
font-display: swapso swapping in your web font doesn’t shove text around.
CLS isn’t just a ranking metric — it’s a trust metric. When buttons jump under thumbs and ads push content down, people lose trust, even if they can’t articulate why. Fixing it makes your site feel professional instantly.
Start with images and scripts — that’s where 70–80% of the gains usually are. Compress your hero/LCP image to WebP or AVIF (under ~100KB), lazy-load below-the-fold images (never the hero), and defer or remove non-essential third-party scripts. Then add a CDN and caching. Most sites improve 40–60% within 30 days from images and JavaScript alone.
Because Google measures real users at the 75th percentile — often someone on a mid-range phone over a slower connection, not you on a fast laptop with fiber. Your lab score can look great while real-user (field) data fails. Always optimize for field data from CrUX and the Search Console report.
Because it’s about JavaScript, not images. INP measures how fast your page responds to interactions throughout the visit. Fixing it means trimming and deferring scripts, breaking up long tasks, and reducing main-thread work — architectural changes rather than a quick compression. Start by auditing third-party scripts.
Platform-Specific Quick Wins
You don’t need a custom build to get fast. The biggest wins depend on your platform:
- WordPress (most business sites): choose a performance-optimised theme like GeneratePress, Kadence, or Blocksy; remove unused plugins; and use an all-in-one performance plugin like WP Rocket or LiteSpeed Cache for caching, minification, and lazy loading. Page builders like Elementor and Divi add weight — use them carefully.
- Shopify: audit your apps aggressively (each adds scripts), keep the product template lean, and make sure the main product image loads eagerly.
- Next.js / React: use the framework’s built-in image and font optimization, static generation for near-zero TTFB, and server components to cut client-side JavaScript.
On any platform, your two free best friends are PageSpeed Insights (pagespeed.web.dev) for diagnosis and Squoosh for image compression. Run PageSpeed Insights on your homepage and one key page before you change anything, so you have a baseline to measure against.
Does Site Speed Matter for AI Search Too?
Yes — and most beginner guides miss this. Fast, well-built pages aren’t just better for Google; they’re easier for AI crawlers to fetch and more likely to be cited. A slow or unreliable server makes bots back off and crawl less. Combined with the clean, crawlable HTML we covered in Chapter 2, speed reinforces your visibility everywhere — search and AI alike. We go deeper on the citation side in get listed in AI search results.
A luxury remodeler in Washington obsessed over their Lighthouse lab score while their real-user (field) data quietly failed on mobile. Once we stopped chasing the lab number and fixed what real visitors experienced — compressing the actual LCP hero image and deferring two heavy scripts — their field data crossed into “good,” and the mobile bounce rate dropped. The lab score barely moved. The field data is what mattered.
Your Site Speed Audit (Beginner Edition)
Run this in order:
- Baseline it. Run PageSpeed Insights on your homepage and one key page. Note LCP, INP, CLS — and whether you have field data.
- Read the field data first. That “real users” section at the top is what Google ranks on.
- Identify the LCP element. Don’t assume — PageSpeed Insights names it. Fix that image or text block.
- Compress and modernize images. WebP/AVIF, sized to display dimensions, hero image loaded eagerly with
fetchpriority="high". - Lazy-load below-the-fold images with
loading="lazy"— never the hero. - Audit third-party scripts. Remove or delay chat widgets, extra analytics, and ad pixels.
- Add explicit width/height to all images, videos, and iframes to kill CLS.
- Add a CDN and caching if your server response (TTFB) is slow.
- Re-test, then wait ~28 days for field data to update in Search Console.
That completes the three technical gates — crawlable, indexable, and fast. Head back to the full guide to see how it all fits together, or revisit the big-picture overview in Chapter 1.
Common Site Speed Mistakes Beginners Make
The repeat offenders from 300+ audits:
- Chasing the lab score while real-user field data fails.
- Lazy-loading the hero image, guaranteeing an LCP regression.
- Compressing every image instead of the one LCP element that matters.
- Ignoring INP because it’s harder than image work.
- Letting third-party scripts pile up — every chat widget and pixel taxes the main thread.
- Missing width/height on media, causing avoidable CLS.
- Expecting instant results — forgetting the 28-day field-data window.
Some of these overlap with the costly assumptions in our SEO myths guide. Track real progress through keyword tracking, Search Console, and GA4.
Speed isn’t a one-time job. New features, scripts, and images degrade your scores over time. Treat Core Web Vitals regressions as bugs, not backlog — re-check after every significant change to your site.
Summary: Open the Final Gate
Site speed is where a found, indexed page either wins the visitor or loses them in the first two seconds. Keep it simple:
- Memorize the three numbers: 2.5s / 200ms / 0.1, all passing at once.
- Trust field data, not lab scores. Optimize for real users at the 75th percentile.
- Fix the LCP element, not every image. WebP/AVIF, eager hero, fast server.
- Tackle INP by trimming JavaScript — audit third-party scripts first.
- Kill CLS with explicit dimensions and reserved space.
- Re-test and wait the 28-day field window before judging.
With all three gates open — crawlable, indexable, fast — your content finally gets the audience it deserves, in search and in AI. Pair this technical foundation with strong content from our on-page SEO checklist, and you’re building on solid ground.
